Visualising the model space with unsupervised learning
Visualising the model space can help us better understand the relationship between climate models and observational products.
Multidimensional scaling
Multidimensional scaling (MDS) is an unsupervised machine learning approach that is used for non-linear dimensionality reduction. The MDS algorithm finds a low-dimensional representation of the data in which the distances respect the distances in the original high-dimensional space. This allows us to better visualise the problem at hand.
I applied MDS to climate model output from the CMIP5 archive. CMIP5 is the 5th phase of the Coupled Model Intercomparison Project created to improve our understanding of the climate system, address outstanding scientific questions, and provide scenarios of future climate change. The climate models submitted to this archive are developed by modelling institutions from around the world. Due to shared model code (and other reasons), those climate models cannot be regarded to be truly independent. I used the distances between a range of climate models, observational products and reanalyses as a proxy for model independence.
Root mean square error (RMSE) between climatological fields of surface temperature over land was calculated which results in a dissimilarity matrix as shown below:
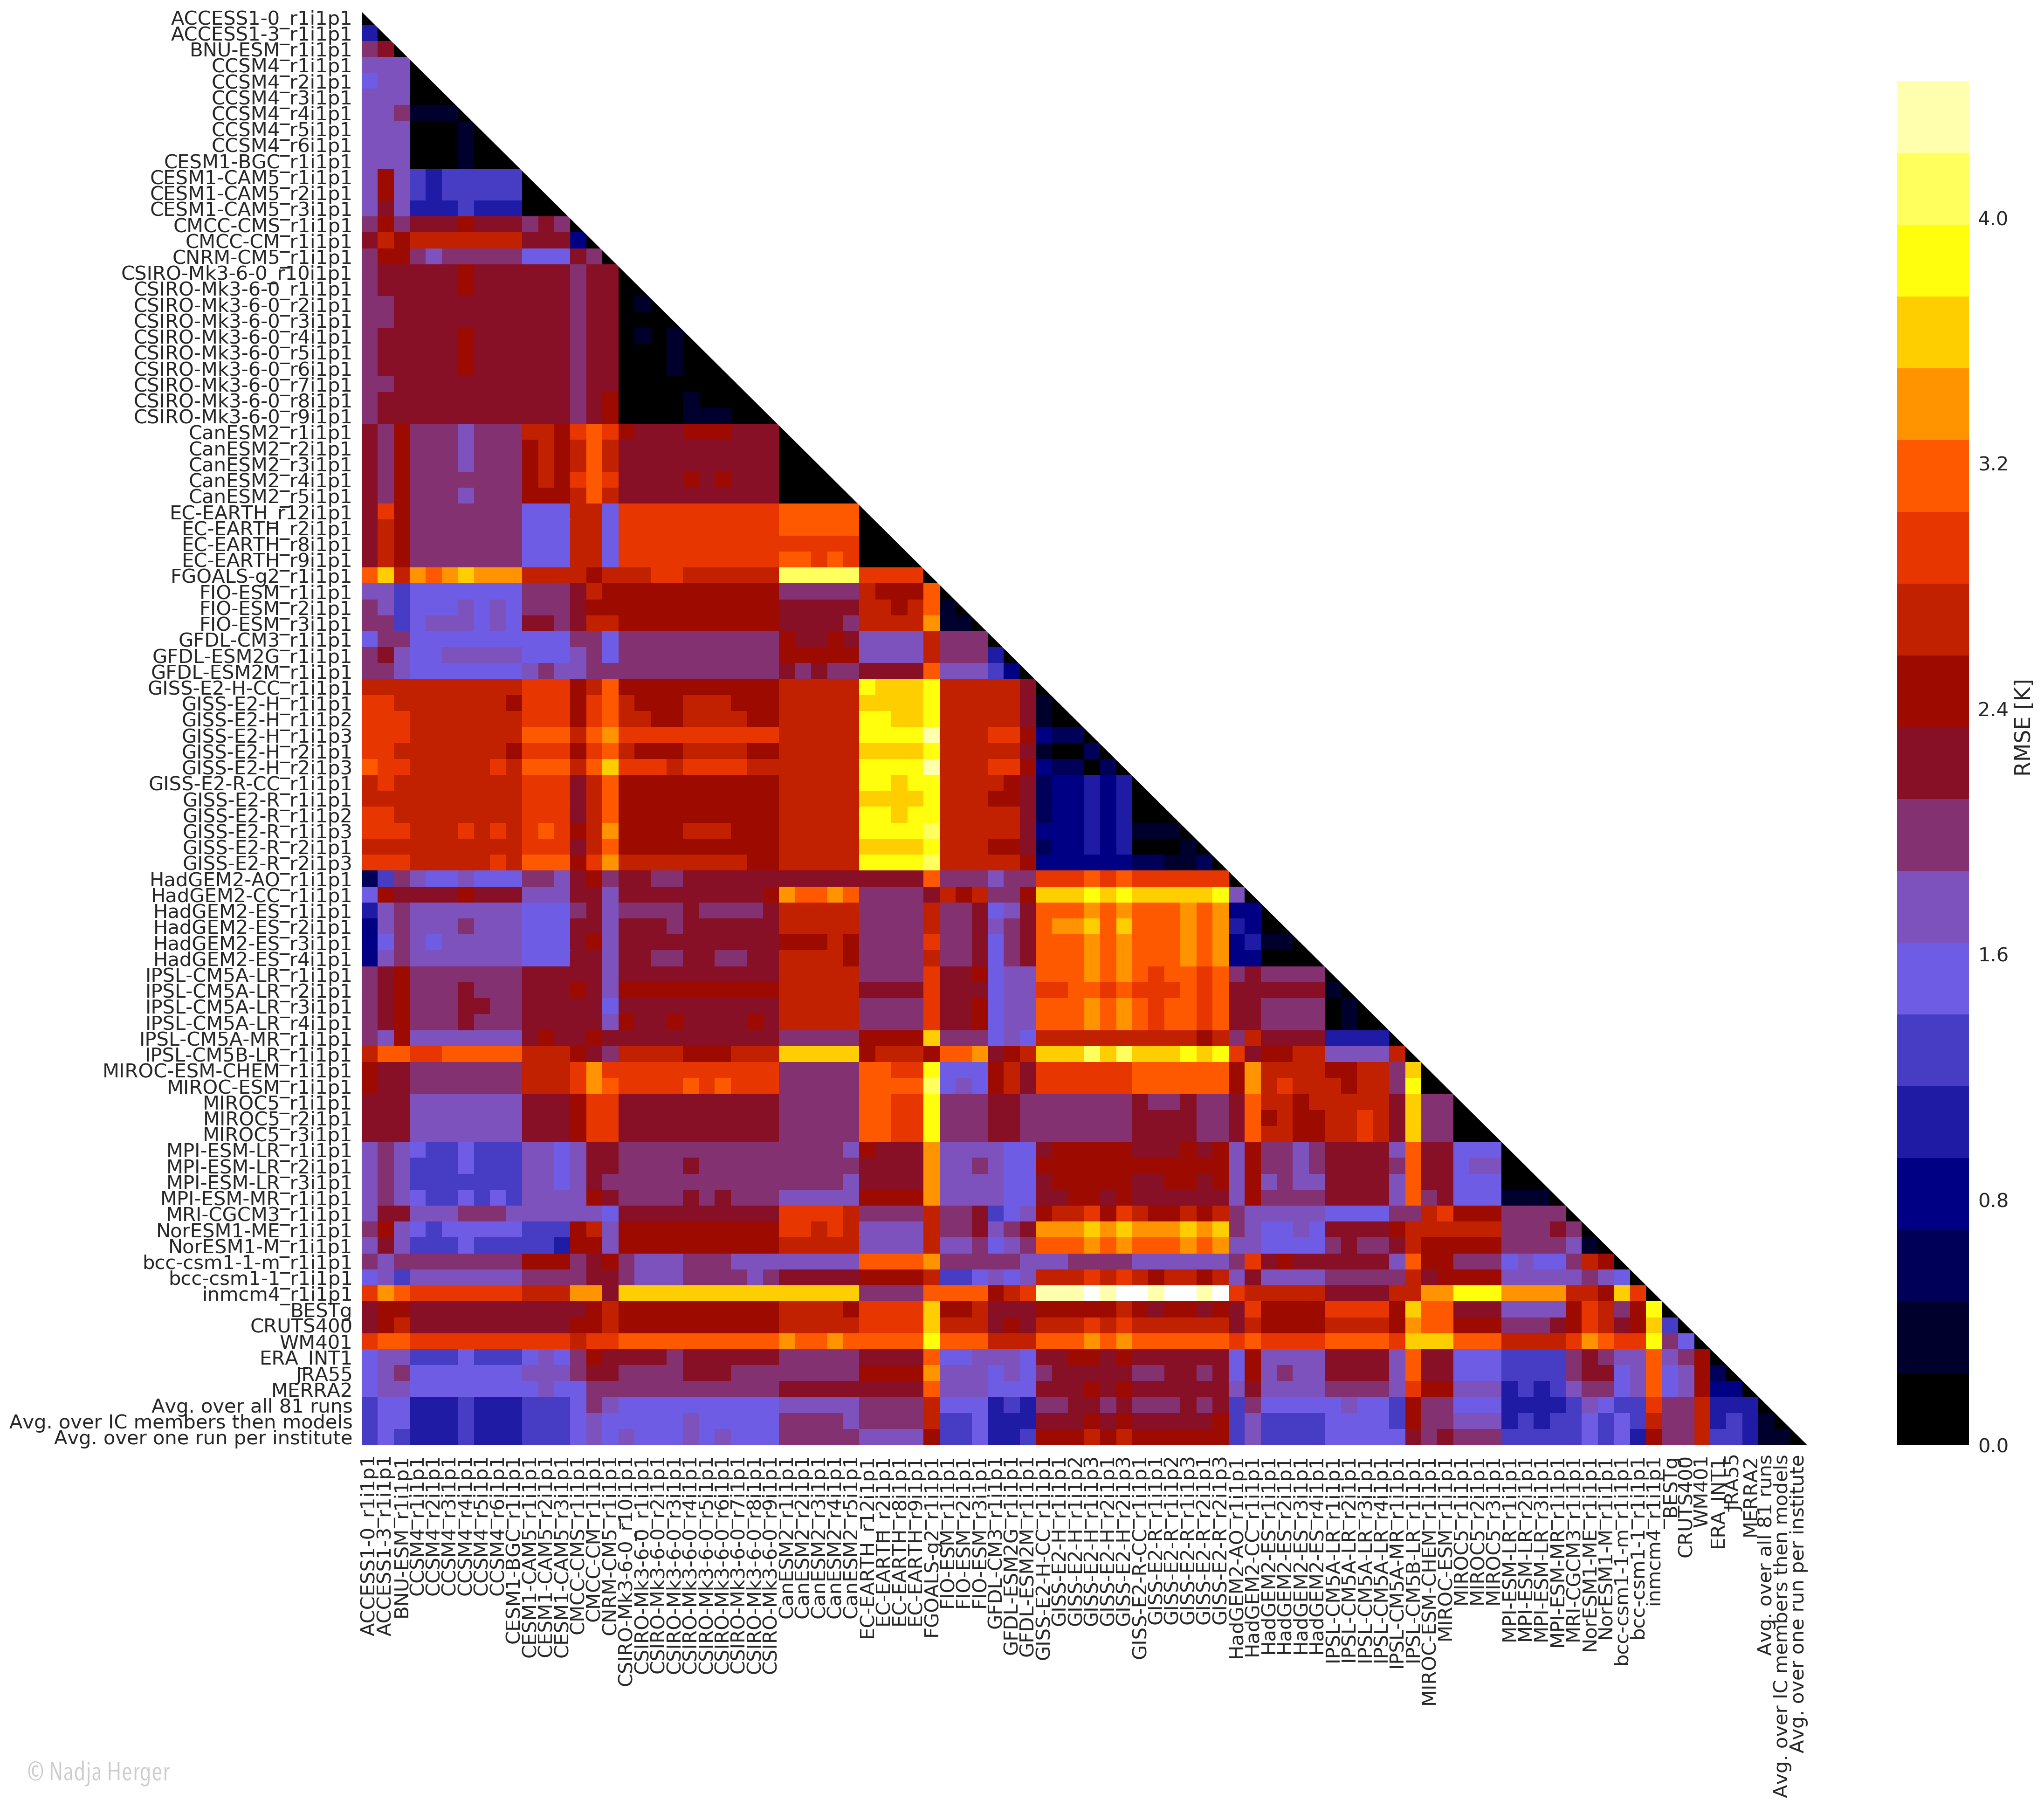
Similar model-model or model-observations pairs are shown in darker colours whereas lighter colours are used for pairs whose climatological fields are quite different. This dissimilarity matrix is the basis for the MDS algorithm with a user-specified dimension for visualisation (2D in this case). The figure below shows the two dimensional model space that results from the dimensionality reduction:
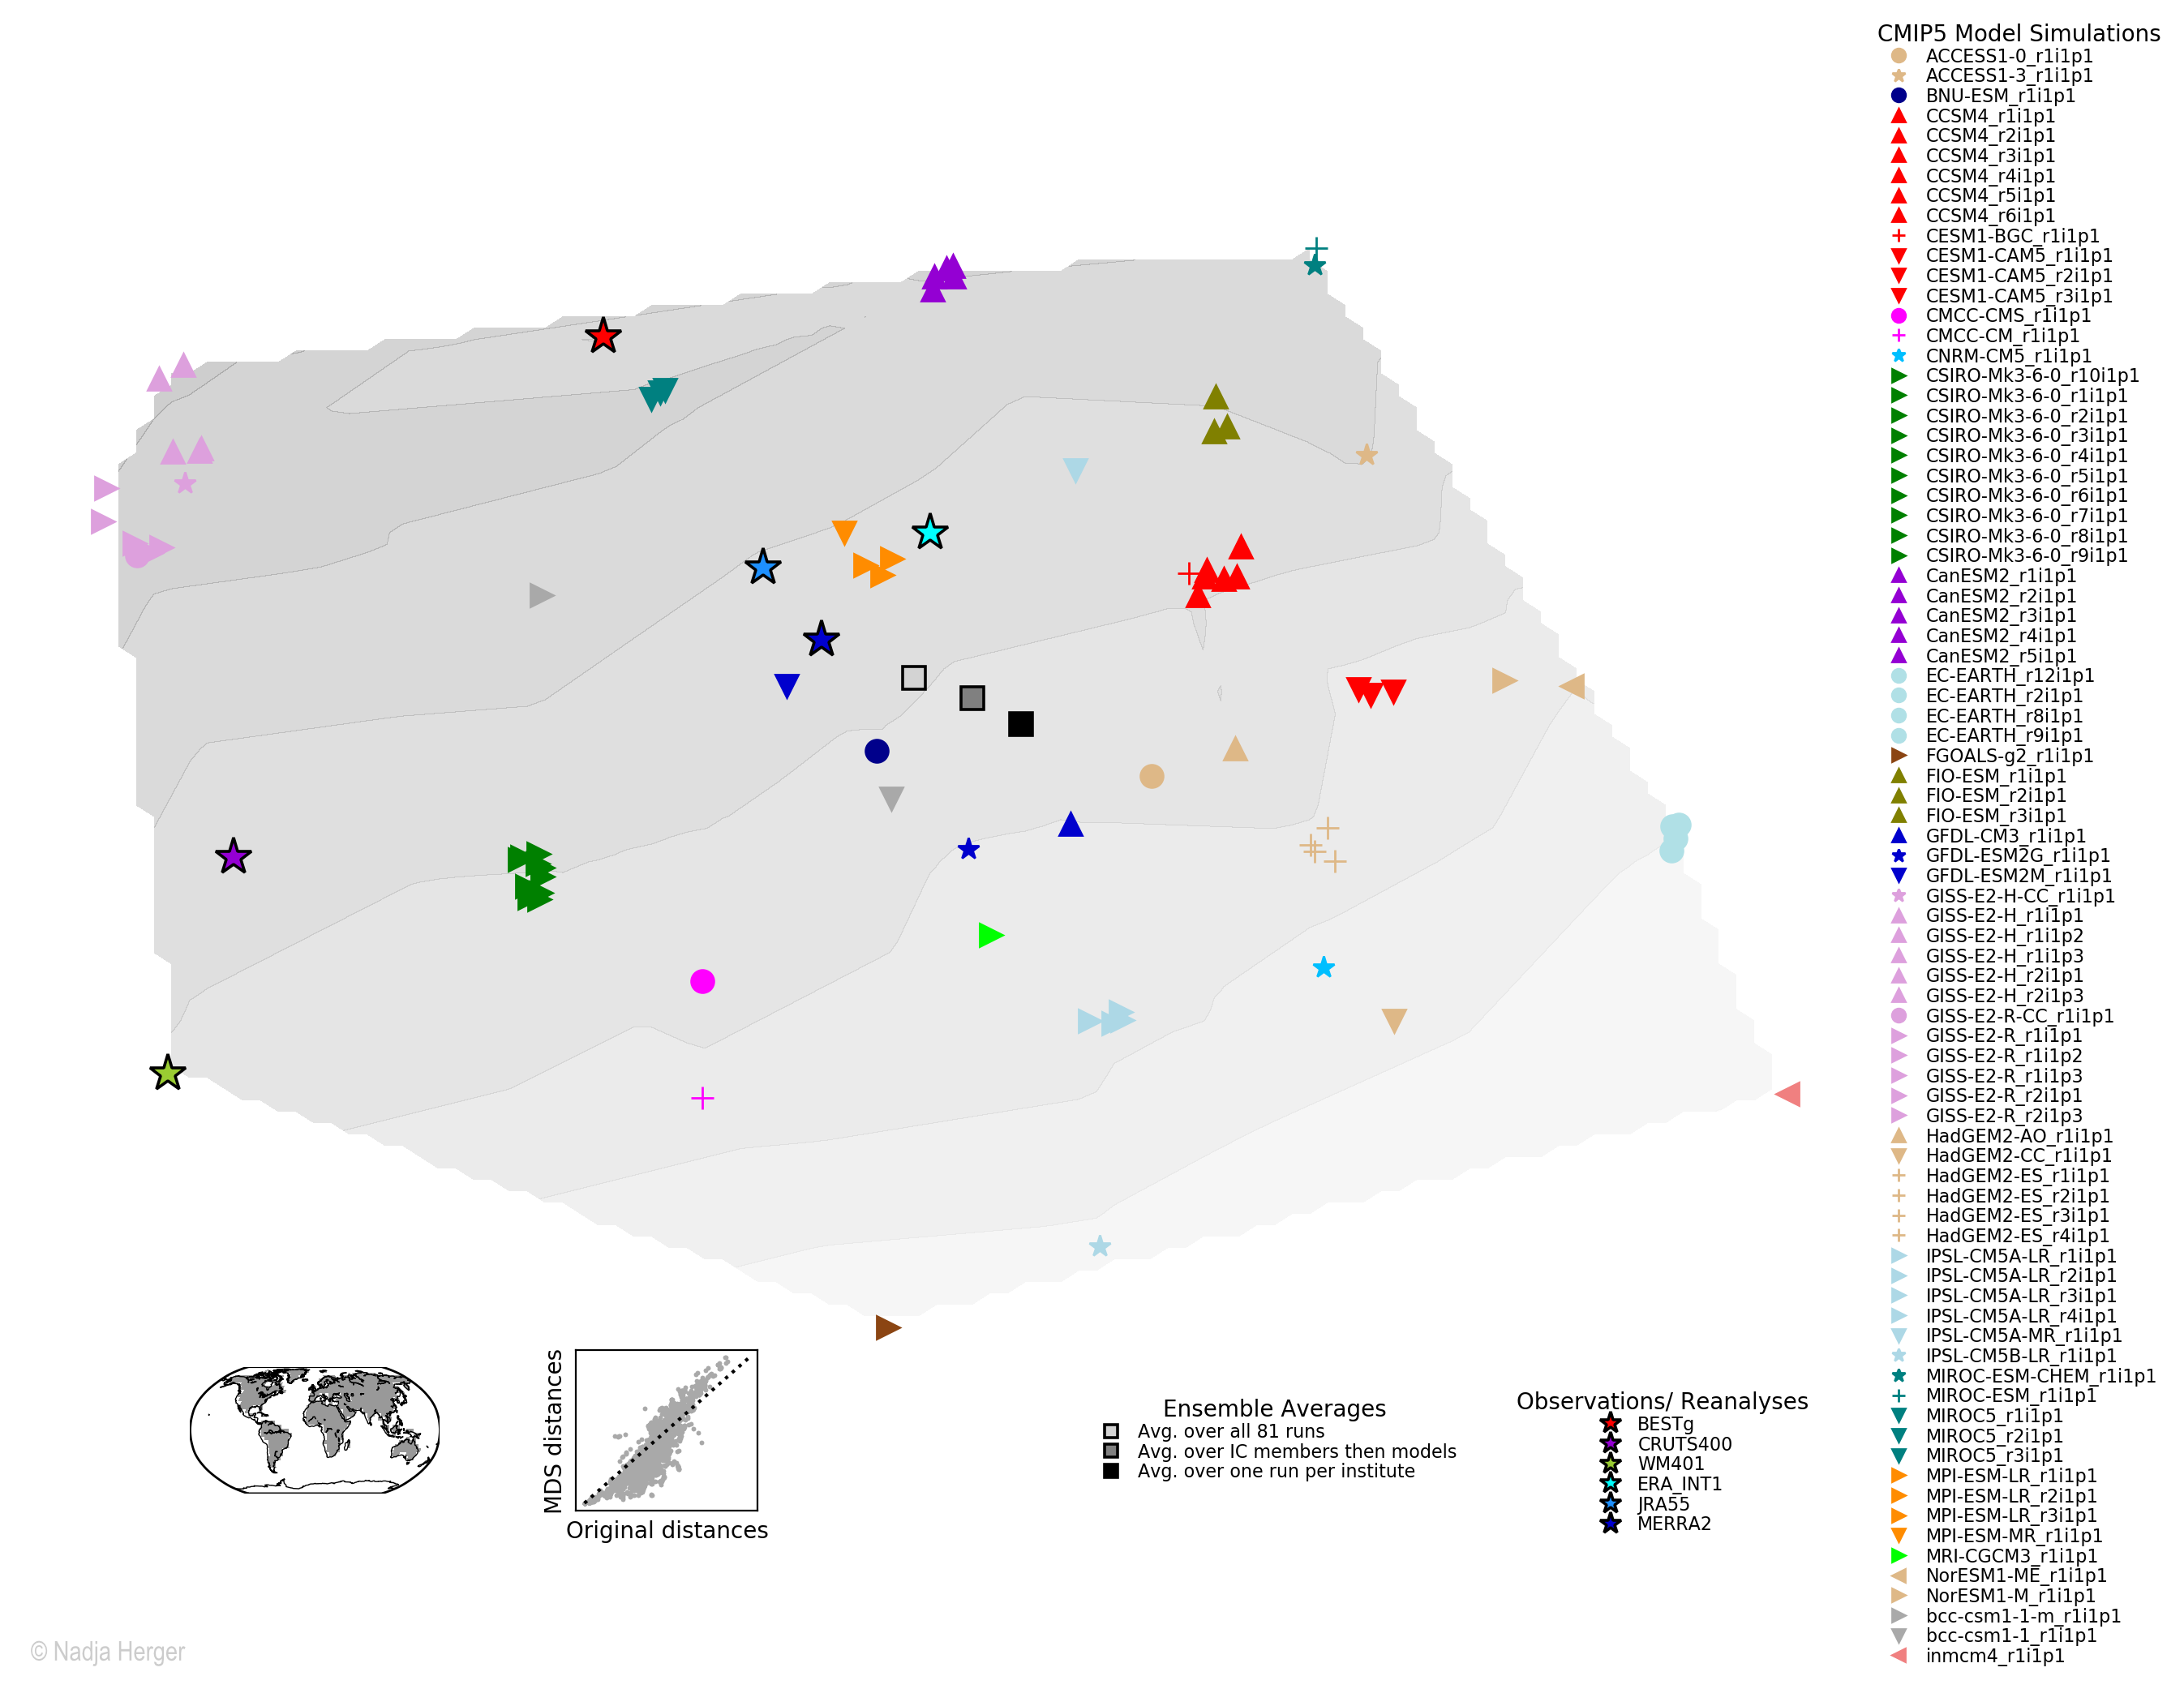
The details here are irrelevant here, but climate models that are known to have a shared model development history are mapped in close proximity indicating their interdependency (e.g. red triangles). To assess the how well MDS managed to preserve the original distances, a so-called Shepard diagram is used as shown in the bottom left corner. It plots the original against the MDS distances. The points should be on the 1-1 line if the distances are perfectly maintained.
Hierarchical Clustering
Another way to visualise the model space is hierarchical clustering, which seeks to build a hierarchy of clusters and is based on the same dissimilarity matrix as MDS. The resulting figure is a dendrogram, or a family tree of climate models:
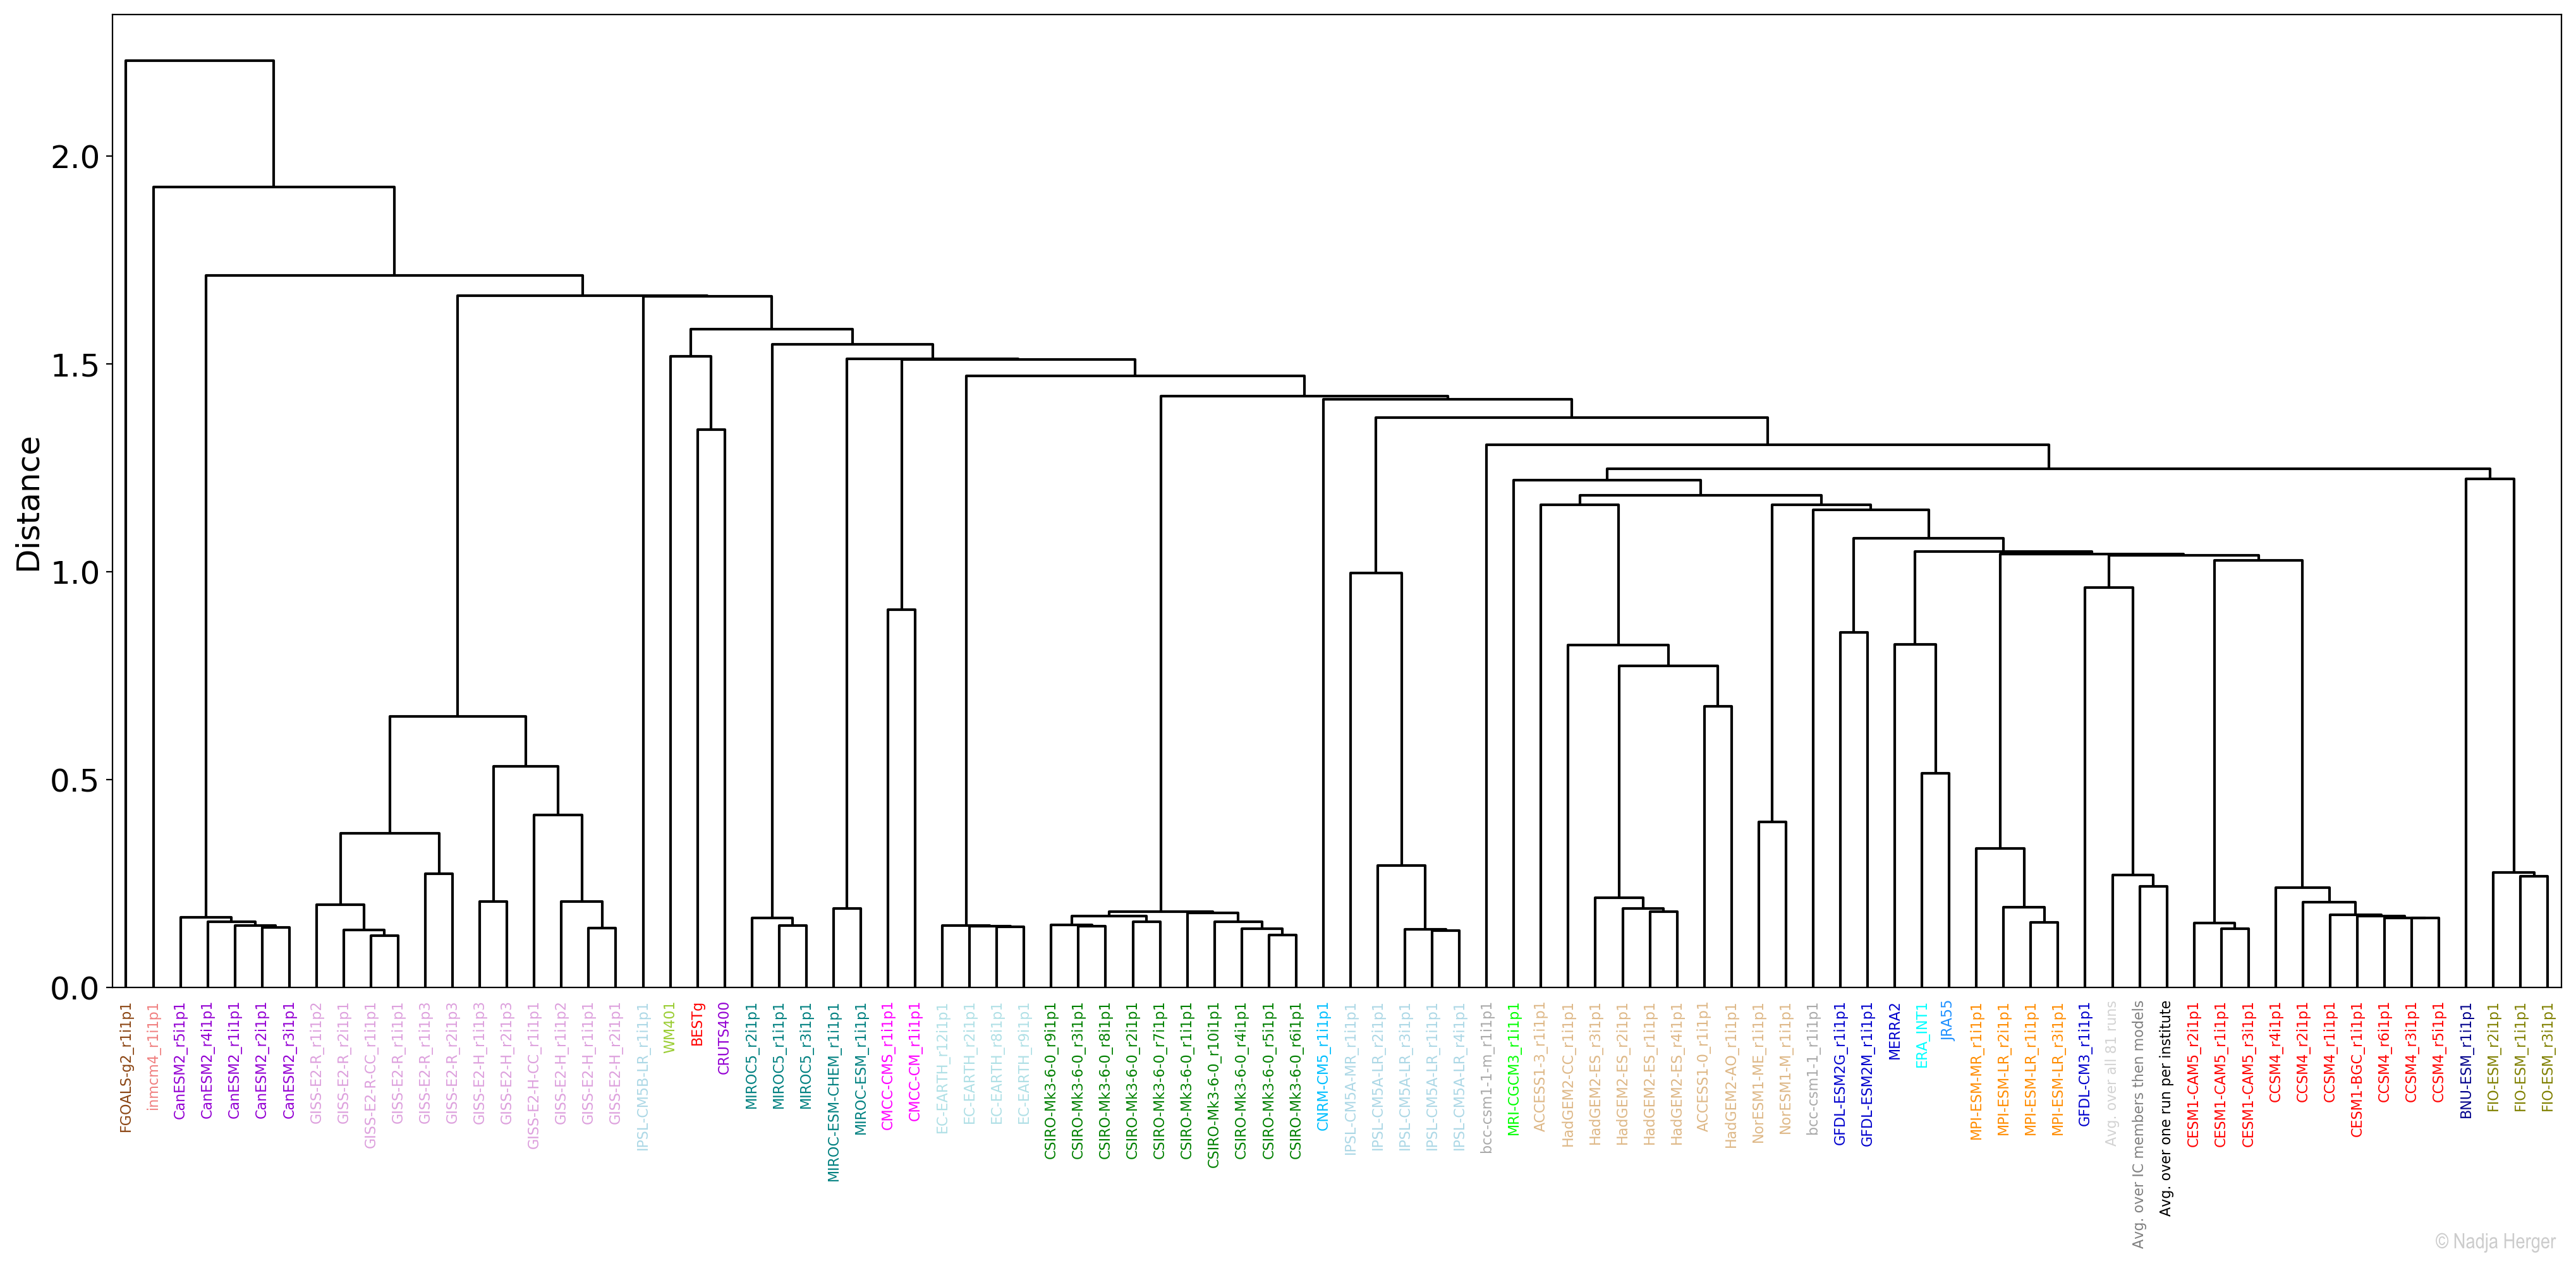
Climate models appearing in the same branch are close to each other in terms of RMSE. Two branches or nodes are more similar the farther down the branching point is located. For a large number of leaf nodes (climate models and observational products), an MDS space is easier to interpret compared to a complex dendrogram.
You can find a sample Python script to conduct MDS and hierarchical clustering on GitHub.

Welcome to my site! I hope you find something interesting here.
- Lessons learned in AI Governance
- My Journey from Climate Science into Responsible AI
- Photo Clustering
- Multi-objective optimisation and Pareto optimality
- Out-of-Sample Testing in Climate Science
- Climate Change Scarf
- Hackathon
- Combinatorial optimisation with Gurobi
- Visualising the model space with unsupervised learning
- Setting up Jekyll on GitHub Pages